
Page 778 - ANUARIO ESTADÍSTICO DE LA UNIVERSIDAD DE SEVILLA 2020-2021
P. 778
Statistical Yearbook 2020-2021
University of Seville
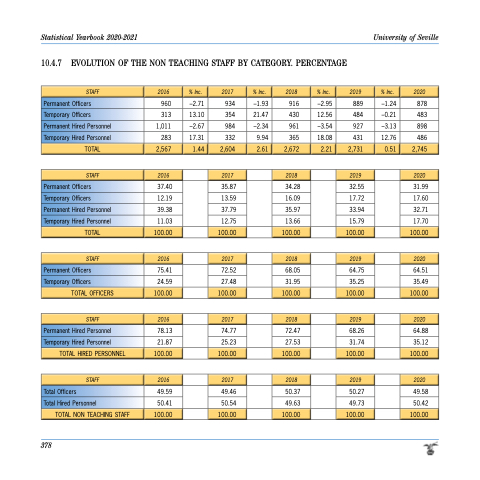
10.4.7 EVOLUTION OF THE NON TEACHING STAFF BY CATEGORY. PERCENTAGE
STAFF
2016
% Inc.
2017
% Inc.
2018
% Inc.
2019
% Inc.
2020
Permanent Officers Temporary Officers Permanent Hired Personnel Temporary Hired Personnel
TOTAL
960 –2.71
313 13.10
1,011 –2.67
283 17.31
2,567 1.44
37.40 12.19 39.38 11.03
75.41 24.59
78.13 21.87
49.59 50.41
934 –1.93
354 21.47
984 –2.34
332 9.94
2,604 2.61
35.87 13.59 37.79 12.75
72.52 27.48
74.77 25.23
49.46 50.54
916 –2.95
430 12.56
961 –3.54
365 18.08
2,672 2.21
34.28 16.09 35.97 13.66
68.05 31.95
72.47 27.53
50.37 49.63
889
484
927
431
2,731
32.55 17.72 33.94 15.79
64.75 35.25
68.26 31.74
50.27 49.73
–1.24
–0.21
–3.13
12.76
0.51
878
483
898
486
2,745
31.99 17.60 32.71 17.70
64.51 35.49
64.88 35.12
49.58 50.42
Permanent Hired Personnel
STAFF
2016
2017
2018
2019
2020
Permanent Officers
Temporary Officers
Temporary Hired Personnel
TOTAL
100.00
100.00
100.00
100.00
100.00
STAFF
2016
2017
2018
2019
2020
Permanent Officers Temporary Officers
Permanent Hired Personnel Temporary Hired Personnel
Total Officers
Total Hired Personnel
TOTAL OFFICERS
100.00
100.00
100.00
100.00
100.00
STAFF
2016
2017
2018
2019
2020
TOTAL HIRED PERSONNEL
100.00
100.00
100.00
100.00
100.00
STAFF
2016
2017
2018
2019
2020
TOTAL NON TEACHING STAFF
100.00
100.00
100.00
100.00
100.00
378
